The beginning of the Renaissance was marked by the emergence of secular people in frescoes. Perhaps one of the earliest frescoes in medieval Europe is the one from the Boyana Church, which we introduced recently in an infographic about the Bulgarian cultural and natural heritage.

Sebastocrator Kaloyan and his wife Desislava
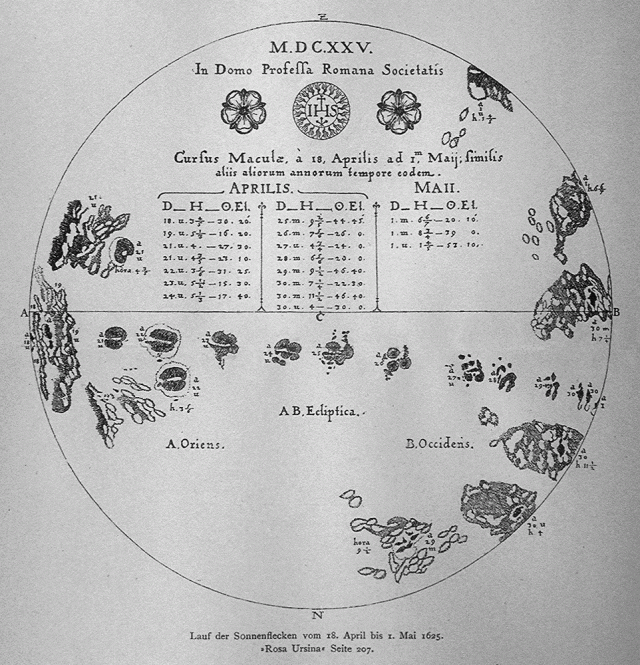
According to other sources, the first infographic appeared in 1626 and was created by Christoph Scheiner, a Jesuit and astronomer, who was one of the first to study solar spots. In his work "Rosa Ursina sive Sol" he provided a series of infographics related to "the movement" of the Sun:

The Industrial Revolution
In 1790, William Playfair, an engineer and economist, published his first data-based chart. He did this in his book "The Commercial and Political Atlas." In order to represent the economy of England in the 18th century, he used statistical graphs using elements which we know from modern graphics - columns, lines, histograms, etc. In another work, he used a pie chart.

The graphical presentation of data quickly became popular, and it started being used in many areas of science - geography, medicine, natural science, the military sphere, and many more.

A representation of the advance of Napoleon in Russia by Charles Maynard

A diagram by Florence Nightingale that informs us about the causes of mortality among soldiers during the Crimean War. The diagram is part of her request to Queen Victoria, for the improvement of conditions in military hospitals. (1857)
The term "graphic" was used for the first time by James Joseph Sylvester in 1878 in order to reflect the relationship between chemical properties and mathematical data.
The 20th century
The rapid development of science introduced the use of graphics in every possible area. Examples are numerous. I will give an example that distinguishes this period from previous eras radically, and that is space exploration. An infographic was used on the first spacecraft which left the boundaries of our solar system - Pioneer 10. A plate of information was put on board in order to indicate, in the case of a possible encounter with an alien intelligent race, the location of our planet and the fact that there is intelligent life on it.

Modern times
The advent of the Internet as a medium of communication led to a rapid development of infographics. The technologies used in them are many and various: Adobe Flash, HTML 5, CSS, various programming languages. The graphic part is entrusted to experienced designers who recreate various types of information in interesting illustrations. There are processed data behind the visual side of infographics. Making infographics is not an easy process. As can be seen, it involves professionals from various fields. In major news agencies and websites, teams responsible for making infographics may consist of several dozens of people. There are companies that specialise in the manufacture of this type of content.
Due to its complexity and growing popularity, specialised literature, aimed at both developers and designers, journalists and statisticians, already exists.
However, the development of technology enables even non-specialists to create beautiful graphics. Sites like Infogr.am, Piktochart and Easel.ly assist in the complex task of making good infographics. They include templates and have the ability to display data from a table. However, this will not save you the necessary task of collecting and processing data or finding appropriate images, but it helps from a technical point of view.
Infographics, created by our team, can be seen in our section "Figures and Facts".