Picture www.tovima.gr
The majority of respondents recognised that corruption is prevalent at all levels of government officials and agencies, but the highest level includes MPs and local leaders. It is also worth noting the fact that this image of the level of corruption worsened in the period 2009-2013.
A vast majority of respondents, i.e. 80%, believe that activities of the political power against corruption are ineffectual and declare that neither the number of arrested corrupt officials is enough, nor do the penalties that have been imposed on them correspond to the seriousness of their crimes.
This is the main conclusion of the study of the University of Macedonia, through which scientists are trying to examine the issue of corruption at the level of public administration and politicians, as well as the means of combating it.
The main "suspects" of corruption are lawmakers, tax officials and city mayors, and this chart is clearly affected by trials of politicians such as former Prime Minister Akis Tsochatzopoulos or Vassilis Papageorgopoulos, who was sentenced to life in prison.
The researchers were surprised when they found that the negative view of the role of the political power in the fight against corruption expanded in 2013 probably as a result of "the rhetoric in terms of the fight against corruption."
Inefficiencies or unwillingness of the political power was determined as the main reason for the flourishing of corruption in Greece (about 80-85% of the public opinion), which is expressed in the imposition of lighter penalties or maintaining of opacity in public spending. Part of the blame belongs to civil servants themselves (according to 60% - 65%), the wrong selection of whom has led to improper performance of their duties or exploitation of legislation for their own benefits in their dealings with citizens.
A degree of social and political trust
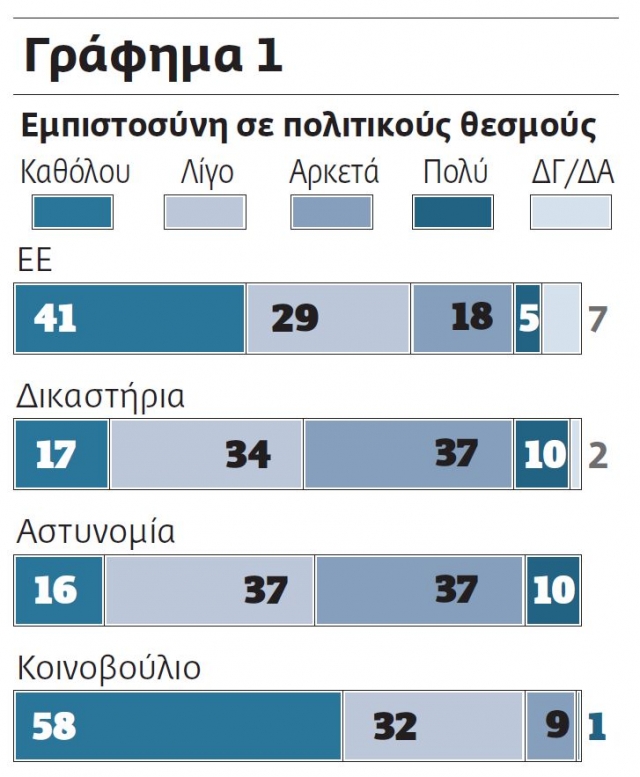
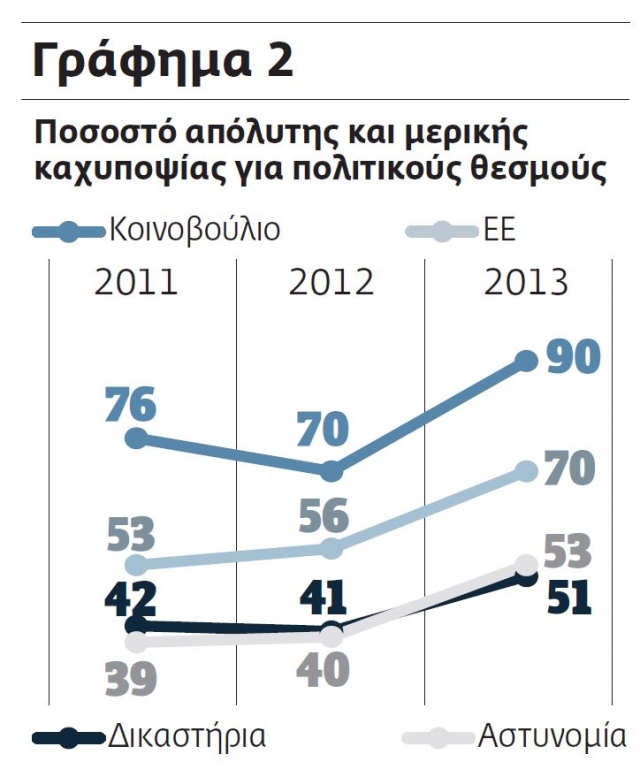
According to researchers, corruption has always been associated with political trust. One of the direct consequences of the increased corruption both of politicians and the country is the loss of trust in political institutions. The survey reflects the political confidence in Greece. Figure 1 reveals the large increase in people’s suspicion in terms of parliament, in which opinions on political parties are woven, as well as the increase of distrust of European institutions. This is an example of the increase of anti-Europeanism of the Greek public opinion during the crisis. Both indicators have significantly worsened compared to the research of the Institute for the Study of Public Opinion and Market of 2011 and 2012 (Chart 2). The percentage of public opinion, reflecting low or zero confidence in parliament reached 90% in 2013 compared to 70% - 75% over the previous two years. The corresponding percentage in the EU reached 70% in 2013 compared to 58% in 2012 and 53% in 2011.
Politicians, who are struggling with the economic crisis, have been losing the fight for political trust in the last 2 years. This loss is not universal - the confidence level remains high among certain social groups. Parliament enjoys a slightly higher percentage of trust in the age category of 45 and the EU gets slightly higher confidence in the age groups under 45, as well as civil servants. Differences in levels of confidence were reflected in the elections in 2012. Zero or low confidence in parliament and the EU was associated with votes for SYRIZA and other parties that oppose the memorandum. Higher trust in both institutions, especially the EU, was associated with votes for New Democracy and PASOK.
Distrust in institutions seems to be also moving towards central political institutions such as the police and courts which had a high rate of confidence in the past (Chart 2).
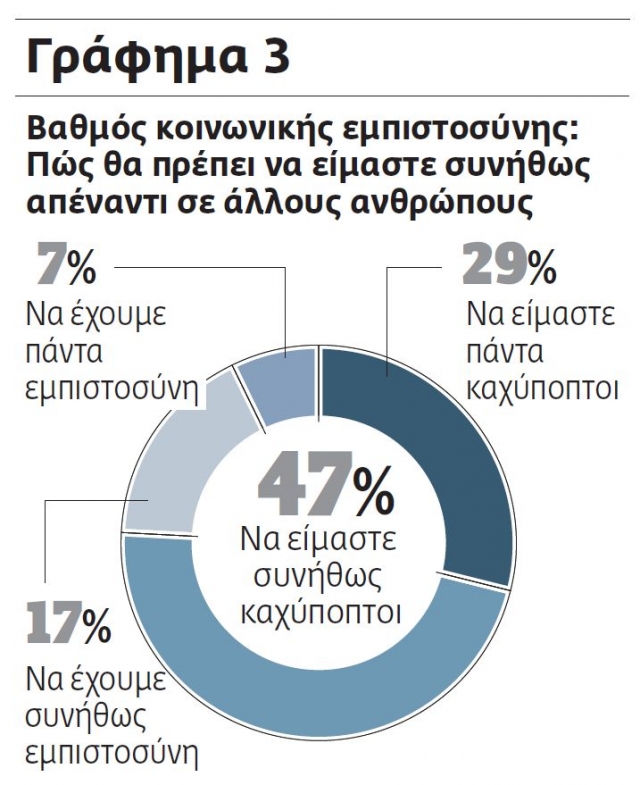
Figure 3 shows a high level of suspicion of the social environment of the average citizen. The percentage of those who think that we should always or often be suspicious of most people exceeds 76% of the sample, while in 2011 it was 69%. Public confidence does not seem to be directly related to the political credibility, since distrust in political institutions is equally high in the whole sample, regardless of the level of public confidence of respondents.
The study describes impressions of the Greek public opinion regarding those categories of civil servants, in which corruption is most widespread. These responses cannot be used as evidence for the existence of corruption in these sectors, but as evidence of impressions of the public opinion. The highest percentage of widespread corruption is among MPs (89%), followed by tax officers (82%) and city mayors (81%) (Table 1). Rates are high for all categories of employees.
Table 1
| Category |
2013 % of respondents who believe that corruption is widespread in this category |
2013 % of respondents who believe that corruption is widespread in this category |
2013 % of respondents who believe that corruption is widespread in this category |
| Police officers |
47 |
50 |
72 |
| Customs officers |
70 |
63 |
74 |
| MPs |
89 |
78 |
74 |
| City mayors |
81 |
68 |
59 |
| Urban development employees |
77 |
64 |
72 |
| Officials from the Ministry of Development |
63 |
47 |
61 |
| Tax officials |
82 |
62 |
72 |
| Doctors |
53 |
75 |
82 |
| University professors |
28 |
33 |
43 |
| Regulatory authorities in the healthcare sector |
40 |
63 |
66 |
The comparison between the percentages of the survey is very interesting compared to data from Eurobarometer in 2011 and 2009. The percentage of citizens who believe that corruption is widely spread among political parties (MPs and local leaders) has increased while the percentage of those who believe that there is corruption in other categories of public employees (doctors, police officers, university professors) has decreased. It is the same in terms of categories such as tax officers, urban development employees, and employees who authorize investment projects, which have also marked a decrease of the negative opinion.
"Yes, I gave a bribe"
In most cases, impressions of corruption in the public sector come from personal experiences. 42% of respondents answered in the affirmative to the question whether they have been asked for a bribe by a public official in order for him or her to solve a problem. The percentage is roughly the same in the different categories. 17% responded that this has last happened in the past 12 months, 25% said that this happened 1 - 3 years ago, and 58% - more than 3 years ago (Figure 4).
The possible association between bribery and the vote in the elections of 2012 is also interesting. At the time, the issue of corruption of public officials was of paramount importance. The two former ruling parties New Democracy and PASOK collected the highest percentage of votes among respondents who answered that they have not been asked for a bribe. Those who responded that they have been asked for a bribe voted for SYRIZA (which won a higher percentage than New Democracy in this category), as well as for the Independent Greeks party and other parties. SYRIZA is 5 points ahead of New Democracy among those who said that they have been asked for a bribe in the last year or in the last 3 years, i.e. during the crisis.
Causes of corruption of public officials
The study seeks views of citizens on causes of corruption of public officials. Table 2 shows answers of respondents that cover a large part of the reasons, which start from the political culture and reach the control and fight against corruption. All explanations are accepted by many citizens, and the highest percentage is collected by those who explain corruption with the reluctance of the government to fight it (82% absolutely agree with this), and opacity in government spending (84% fully agree with this). Explanations that affect the quality of civil servants themselves, or people who think that windows in legislation allow employees to ask for money, have accumulated lower rates, as well as the opinion of those who identified the culture of the Greek society that perceives bribery as the main reason.
Differences in explanations among various demographic groups are not significant. The causes of corruption, which are based on poor quality of staff and gaps in laws gained the largest support among respondents over 55 years of age (about 75%) and graduates of compulsory education, and those with no education (80 % compared to 66% of the whole sample). The differences in the opinion among public and private employees are also interesting. The notion that civil servants are not selected properly and therefore cannot be relied upon in terms of the performance of their duties is supported by only 38% of civil servants compared to 60% of workers in the private sector.
Table 2
|
|
AA
|
TTA
|
TTD
|
AD
|
DN/DNWA
|
|
The political power is not doing anything in order to stop corruption
|
82
|
13
|
3
|
1
|
1
|
|
Civil servants are not selected properly
|
65
|
17
|
11
|
5
|
2
|
|
There is no transparency in government spending, which leads to easy misuse
|
84
|
10
|
3
|
1
|
2
|
|
Windows in legislation which give employees the opportunity to demand bribes from citizens in order to service them
|
63
|
18
|
8
|
7
|
4
|
|
Penalties for bribery are not strict
|
78
|
9
|
4
|
4
|
5
|
|
Penalties for misuse of public money are not strict
|
82
|
7
|
4
|
4
|
3
|
|
Many people in Greece accept corruption as part of everyday life
|
65
|
19
|
6
|
8
|
2
|
|
Difficult economic conditions favour bribery and misuse as a means of increasing revenues of employees
|
51
|
20
|
11
|
12
|
6
|
Legend: AA = absolutely agree, TTA = tend to agree, TTD = tend to disagree, AD = absolutely disagree, DN/DNWA = I do not know / do not want to answer
The explanation that associates corruption with the political culture is accepted mostly by liberal professions (80% vs. 2/3 of the total sample).
Table 3 shows the percentage of those who have chosen all explanations of corruption in 2009 and 2011. Again, the highest percentage is for the unwillingness of the political power to deal with corruption (57% in 2011), as well as transparency in government spending (43% in 2011). The explanation that associates corruption with the political culture in the past is accepted by fewer people (21%). The percentage of the explanation of the reluctance of the government to fight corruption increased the most between 2009 and 2011.
Table 3
|
|
2011
|
2009
|
|
The political power is not doing anything in order to stop corruption
|
57
|
52
|
|
Civil servants are not selected properly
|
30
|
32
|
|
There is no transparency in government spending, which leads to easy misuse
|
43
|
41
|
|
Windows in legislation which give employees the opportunity to demand bribes from citizens in order to service them
|
37
|
36
|
|
Penalties for bribery are not strict
|
43
|
37
|
|
Penalties for misuse of public money are not strict
|
43
|
37
|
|
Many people in Greece accept corruption as part of everyday life
|
21
|
19
|
The survey was conducted among 1,116 residents across Greece by telephone using a questionnaire. Different strata are presented accordingly. The questionnaire included "a survey experiment", which aims to subject random groups of the sample to certain scenarios. The total statistical error is up to ± 3.0%.


